How Artificial Intelligence Is Changing the Way Traders Read the Market
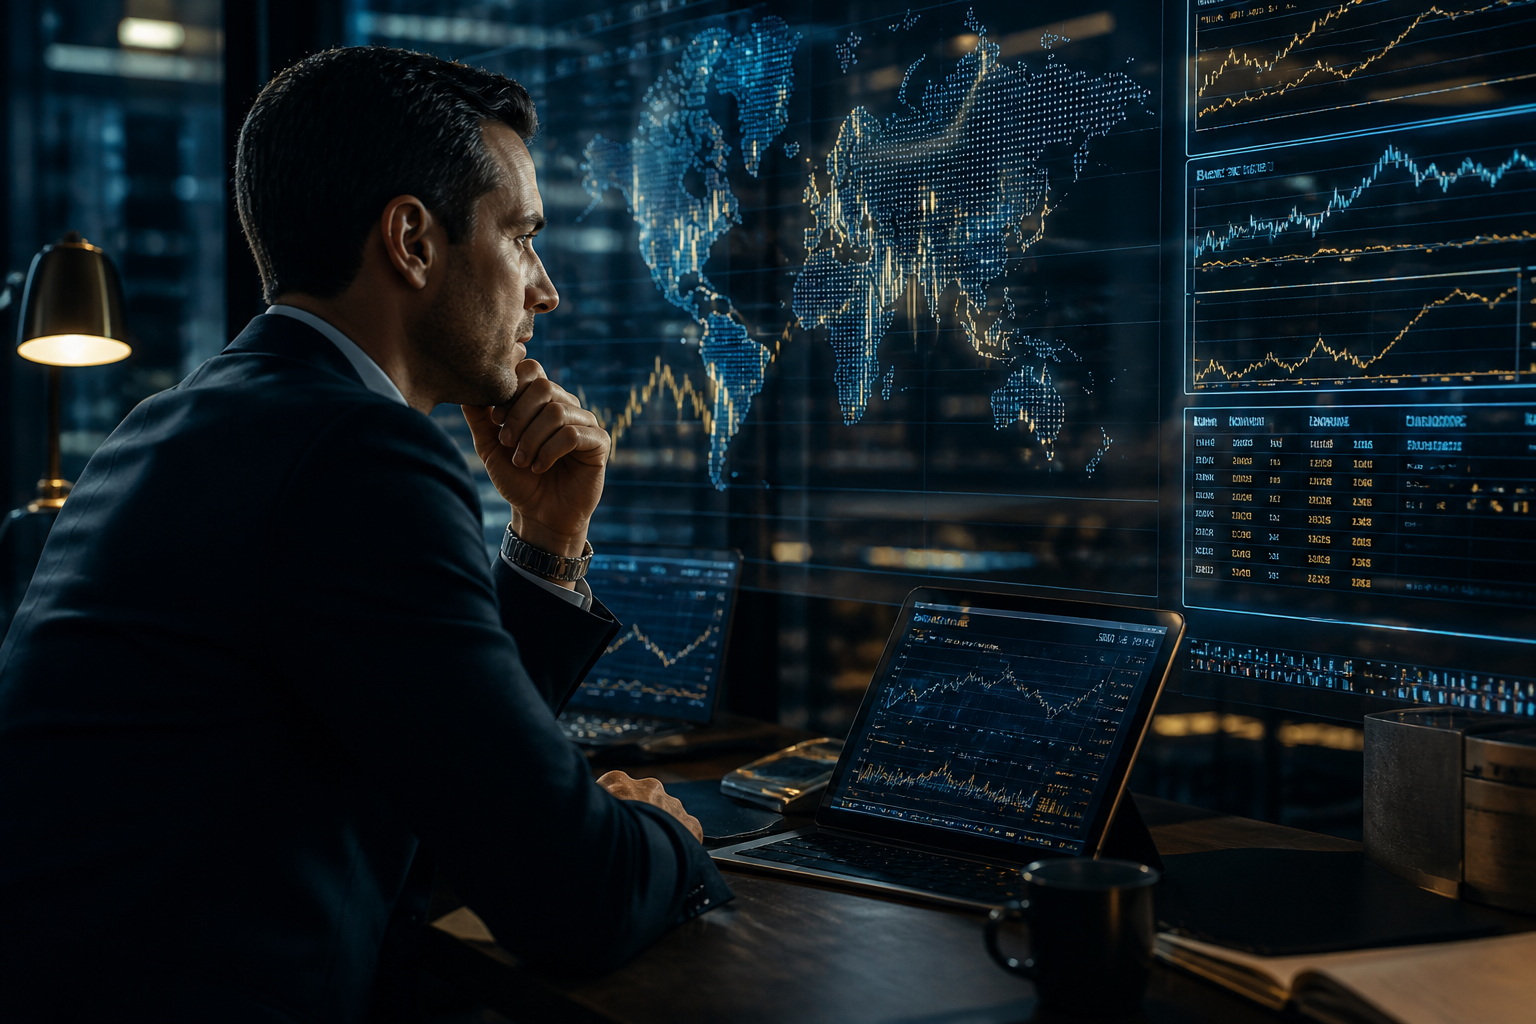
Financial markets generate an overwhelming volume of information every second — price movements, order flow, news headlines, and shifting sentiment across millions of participants. For decades, traders relied almost entirely on experience, intuition, and manual chart study to make sense of it all. That is no longer the only option. A growing number of trading platforms and independent developers have built systems capable of scanning price data, spotting recurring patterns, and flagging opportunities long before a human eye would catch them.


This shift is not about replacing the trader. It is about giving traders a second set of eyes — one that never gets tired, never lets emotion cloud a decision, and can process years of historical data in the time it takes to refresh a chart.
Reading Charts the Way a Seasoned Analyst Would
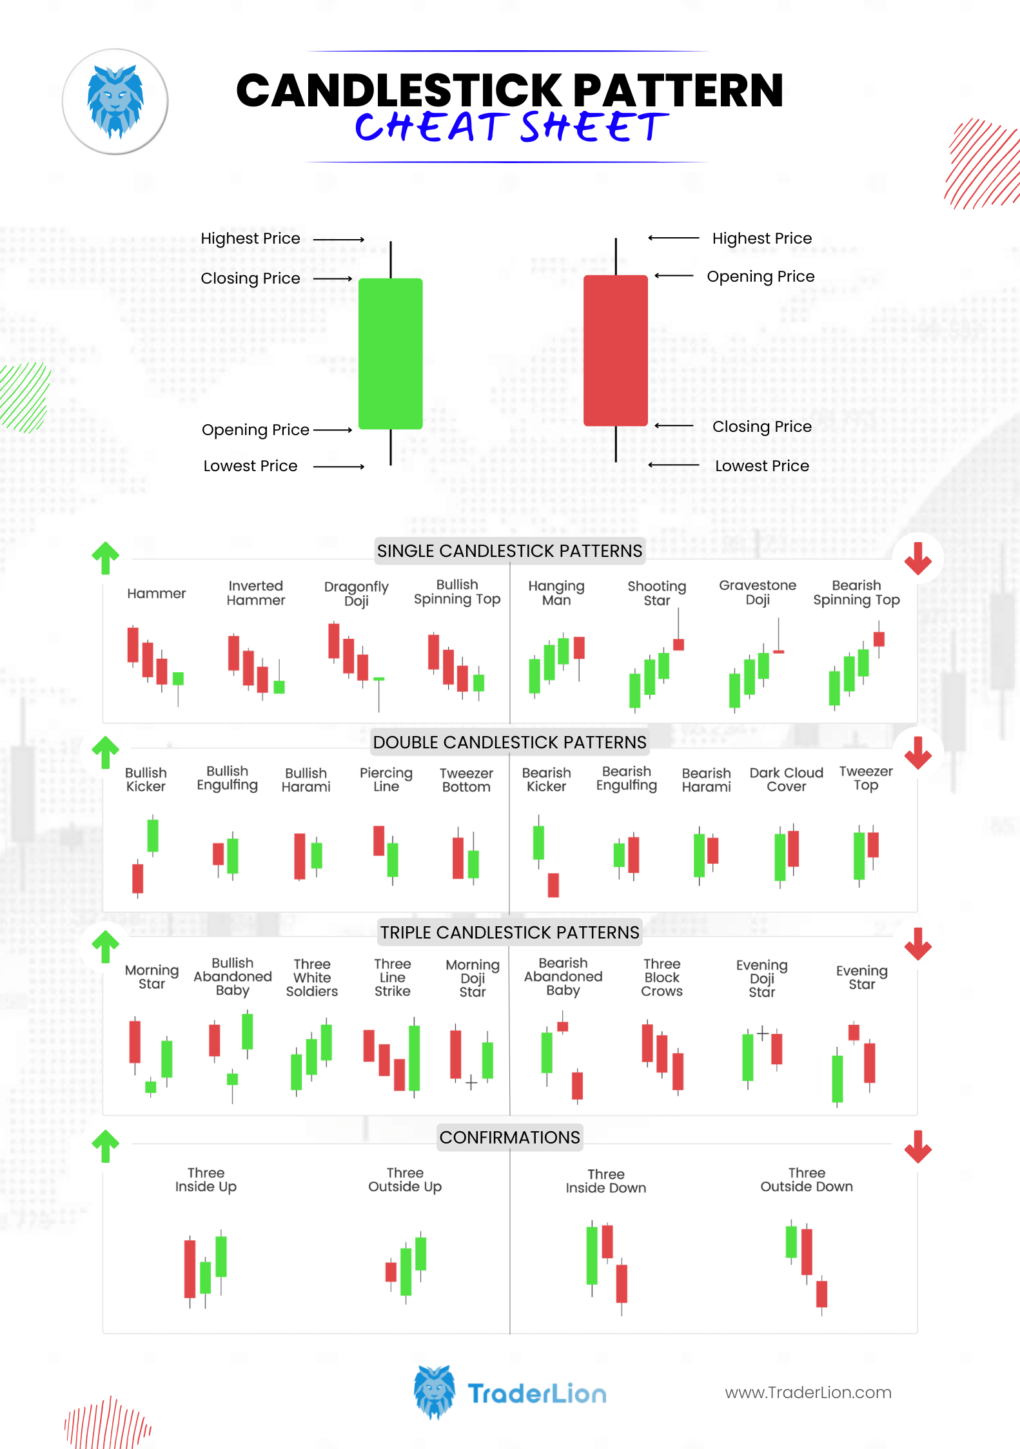
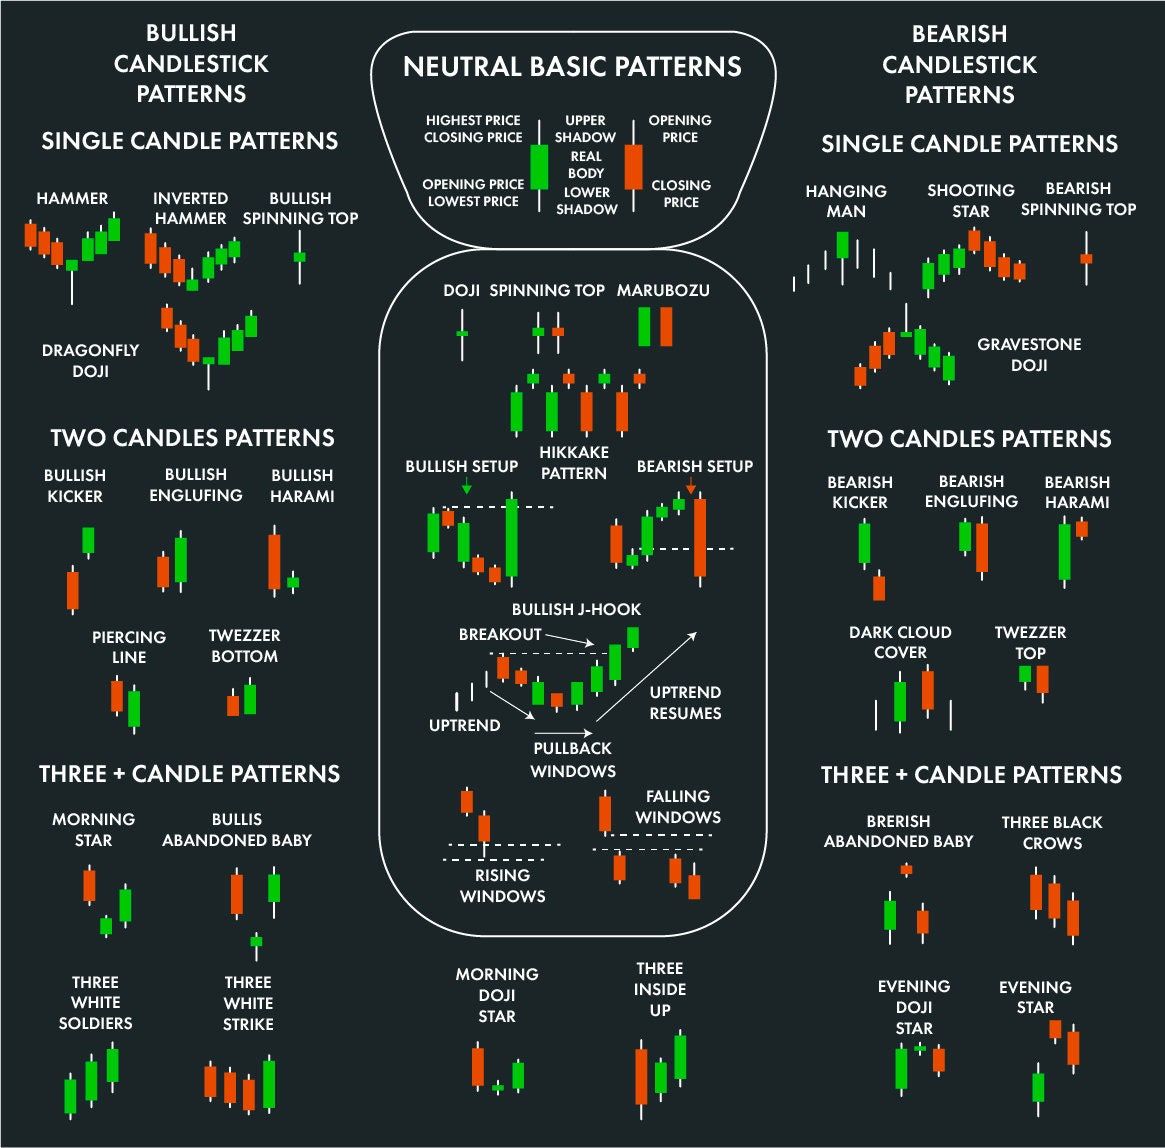
Technical analysis has always depended on recognizing shapes and structures in price movement: support and resistance zones, head-and-shoulders formations, breakouts from consolidation ranges. What separates a beginner from a seasoned analyst is often the sheer number of charts they have studied over the years, which sharpens their eye for what matters and what is noise.
Modern systems approach the same problem differently. By training on enormous historical datasets across countless instruments and timeframes, they learn to recognize the statistical fingerprints of these formations far faster than a person scrolling through charts one at a time. A pattern that might take an analyst several minutes to confirm — checking volume, comparing it against similar past setups, weighing the surrounding trend — can be surfaced almost instantly, along with a measure of how often that same pattern has historically preceded a move in either direction.
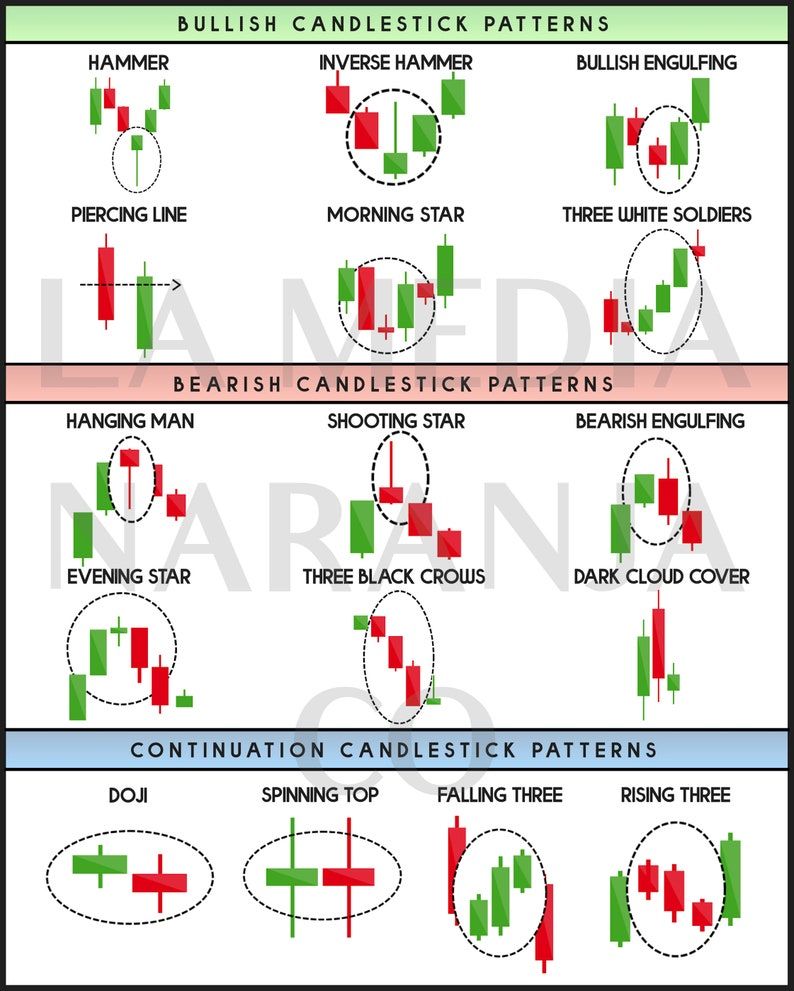
This does not remove the need for judgment. A trader still has to decide whether a signal fits the broader market context, whether liquidity is thin enough to distort the pattern, or whether a scheduled economic release makes the setup unreliable for the next hour. What changes is the starting point: instead of hunting for the pattern manually, the trader begins from a shortlist of relevant, statistically grounded observations and applies their own filter on top.
Supporting the Decision, Not Making It Alone
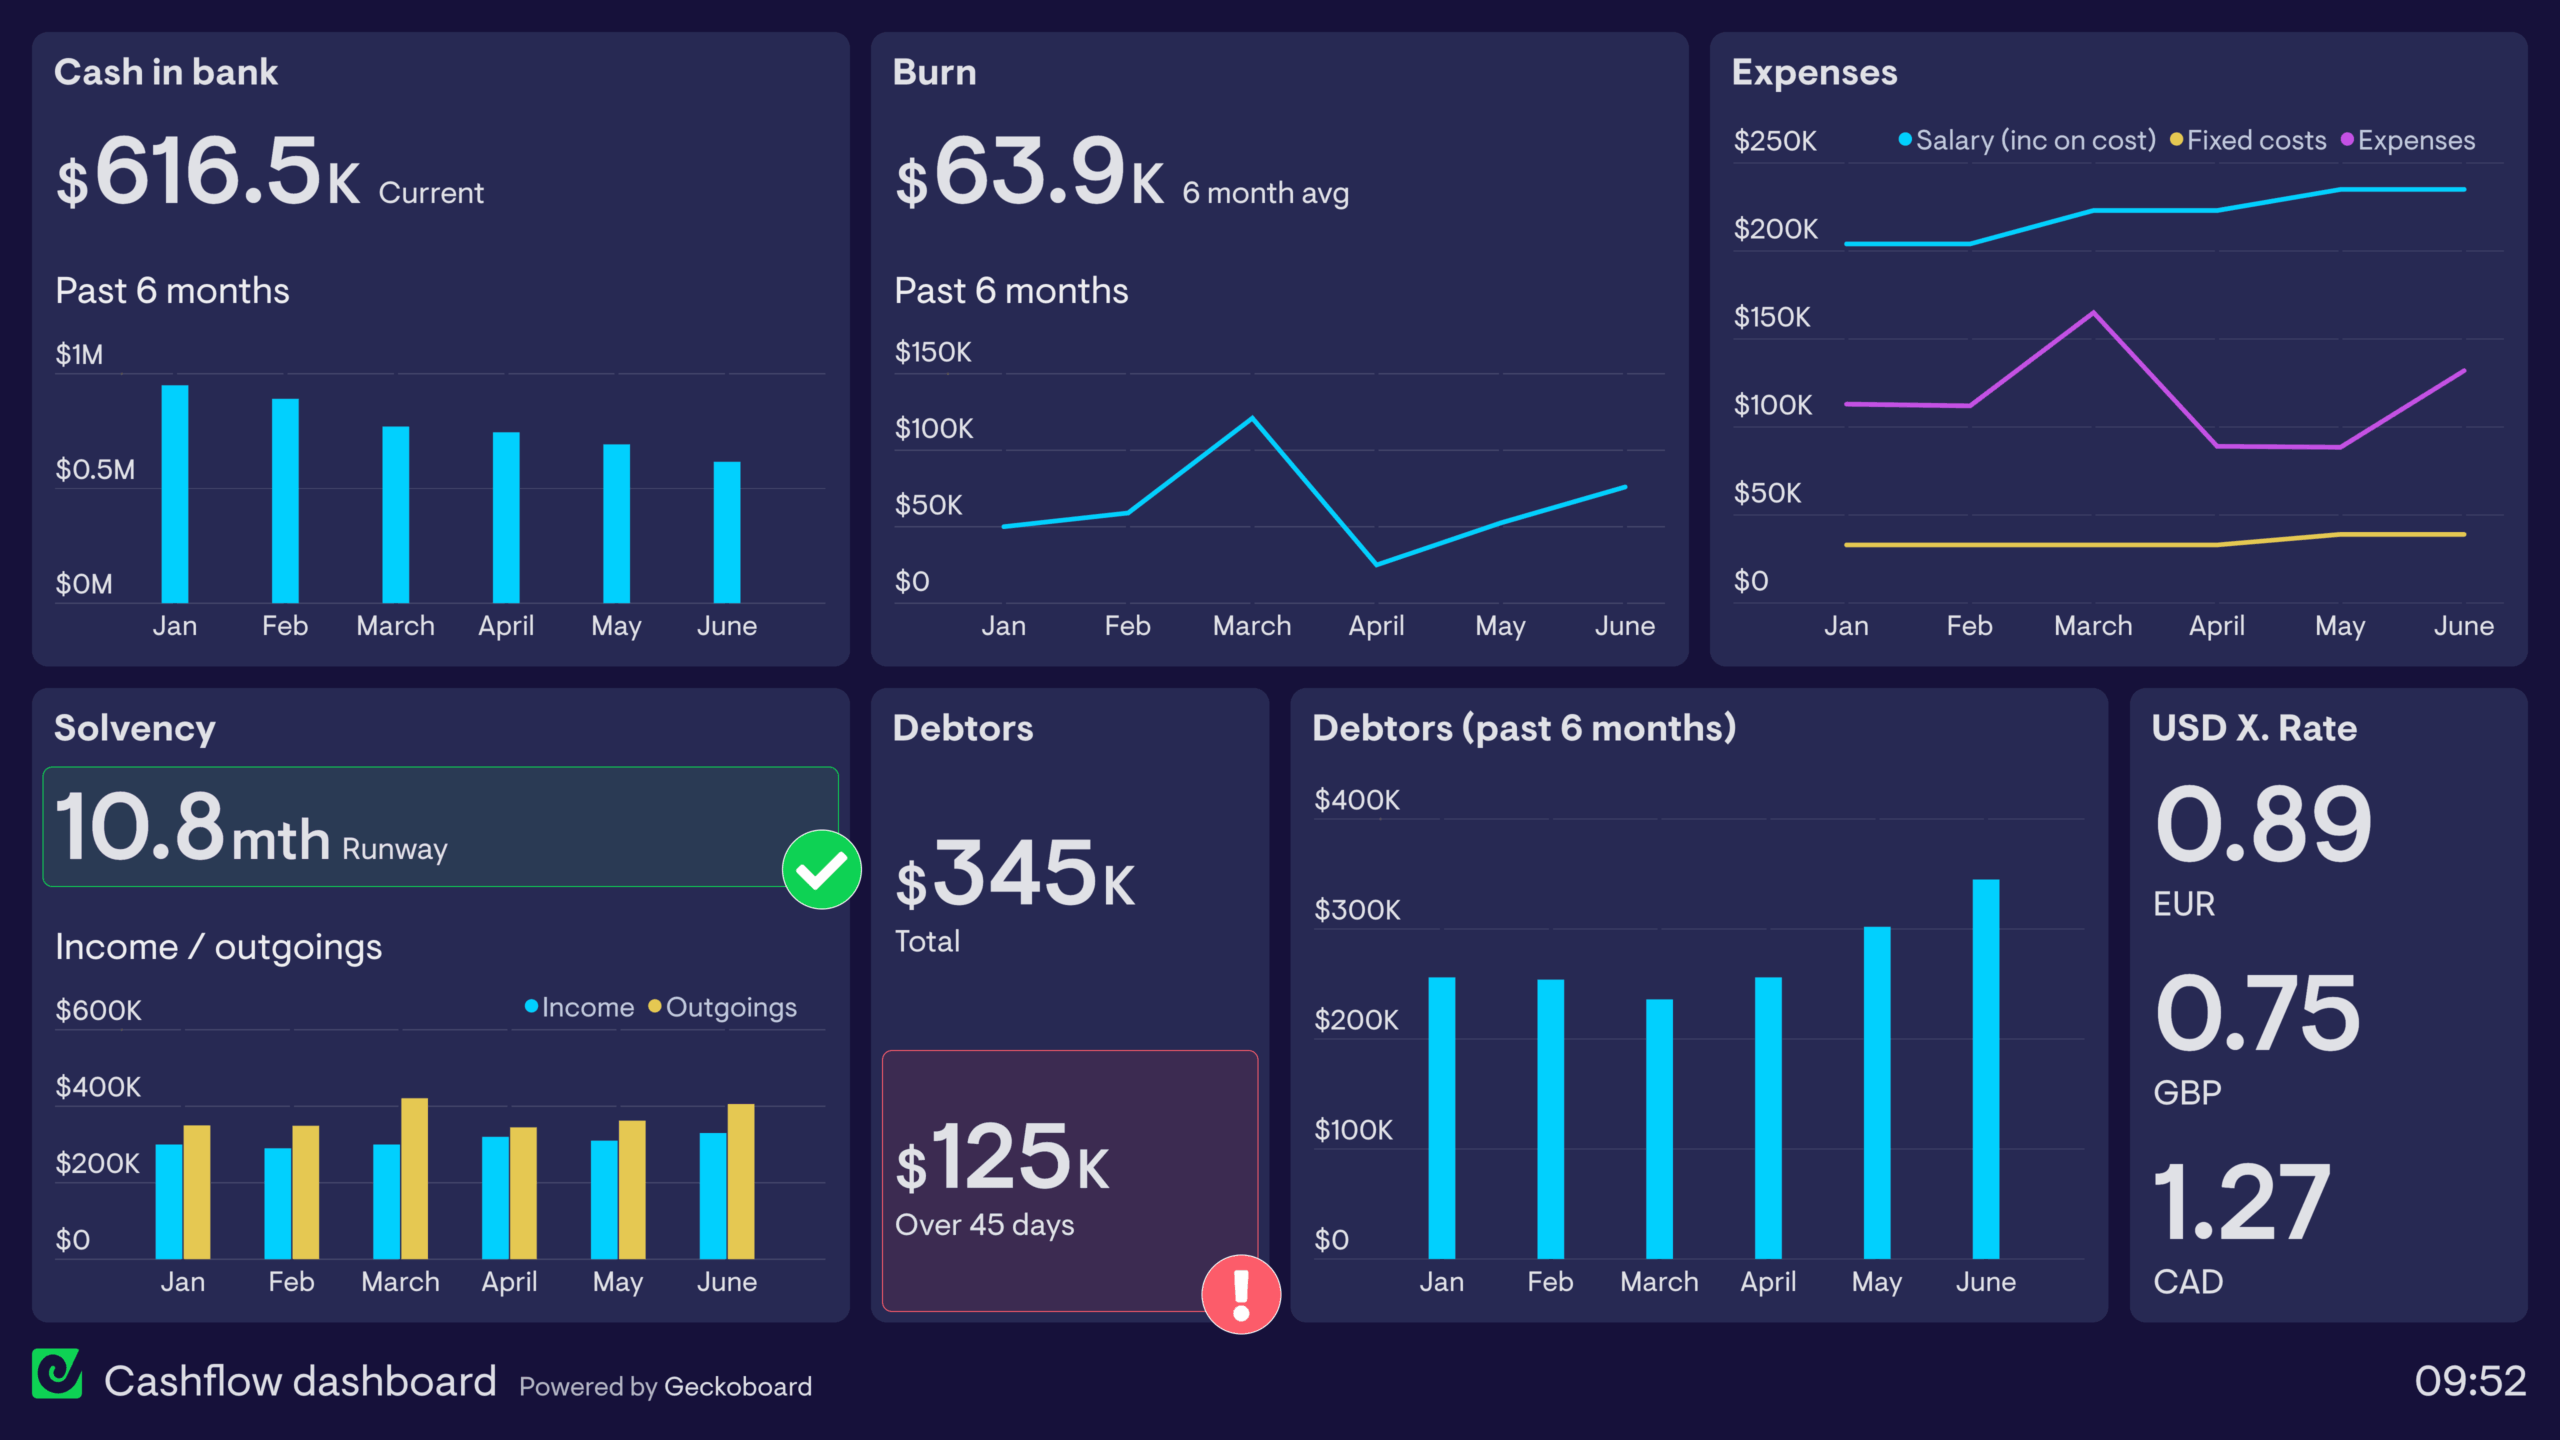
Chart reading is only one piece of the puzzle. A sound trading decision usually weighs several layers at once — price action, broader trend direction, risk exposure relative to account size, and sometimes the tone of news coverage or social sentiment around an asset. Keeping track of all of that manually, in real time, is demanding even for full-time professionals.
Analytical systems built for this purpose can process these layers simultaneously. They can compare a current setup against thousands of similar historical instances, estimate a probability-weighted outcome, and present it alongside a suggested risk-to-reward ratio. Some go further, scanning financial news and public commentary to gauge whether sentiment around an asset is turning before that shift becomes obvious on the price chart itself.
The value here is less about generating a “buy” or “sell” signal and more about narrowing the decision space. A trader working through dozens of watchlist symbols each morning benefits enormously from a system that pre-filters which ones deserve closer attention, so their limited time and attention go toward the setups that actually matter.
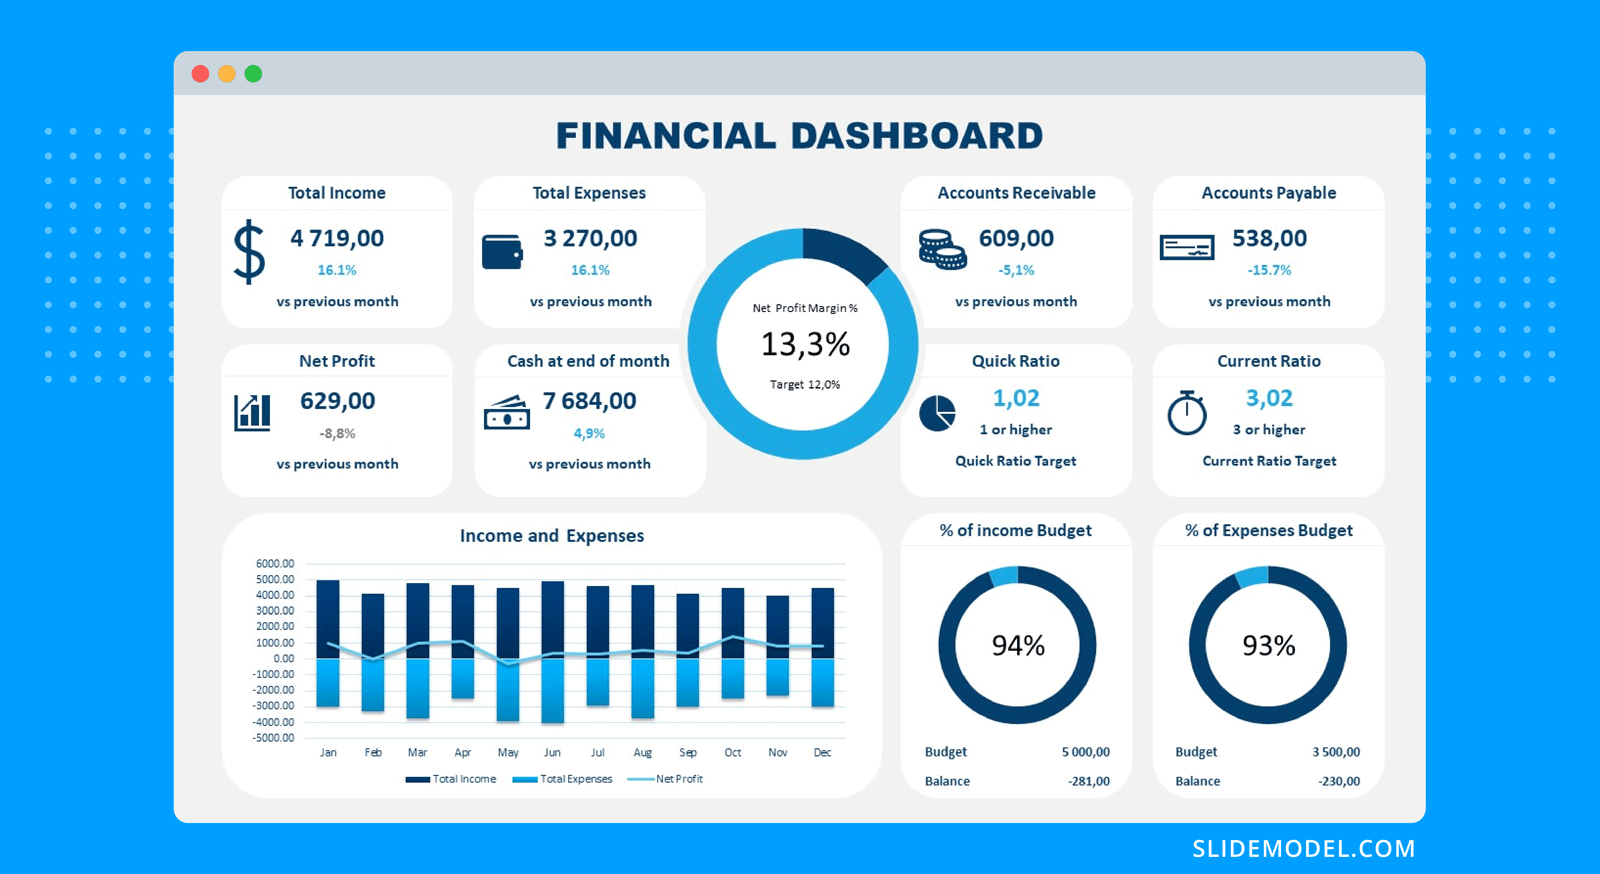
Discipline is another quiet benefit. Emotional decision-making — chasing a rally out of fear of missing out, or holding a losing position too long out of hope it will recover — is one of the most common reasons traders underperform their own strategies. A system that evaluates a setup purely on data has no such attachment. It will flag the same conditions the same way whether the trader just had three winning trades in a row or three losing ones.
Professional Traders Are Building Their Own Indicators
Perhaps the most significant development has come from professional and semi-professional traders who no longer wait for platforms to release new tools. Using accessible programming environments, they now design and test their own custom indicators, tailored to a specific strategy, asset class, or trading style that off-the-shelf indicators were never built to capture.
The process typically starts with a hypothesis: perhaps a trader has noticed that a particular combination of volume spikes and short-term volatility tends to precede sharp moves in a specific currency pair. Rather than relying on a generic indicator that only loosely approximates this idea, they can now describe the logic, have a model help translate it into working code, and backtest it against years of historical data within a single session. What once required weeks of manual coding and statistical validation can now be prototyped and refined in an afternoon.
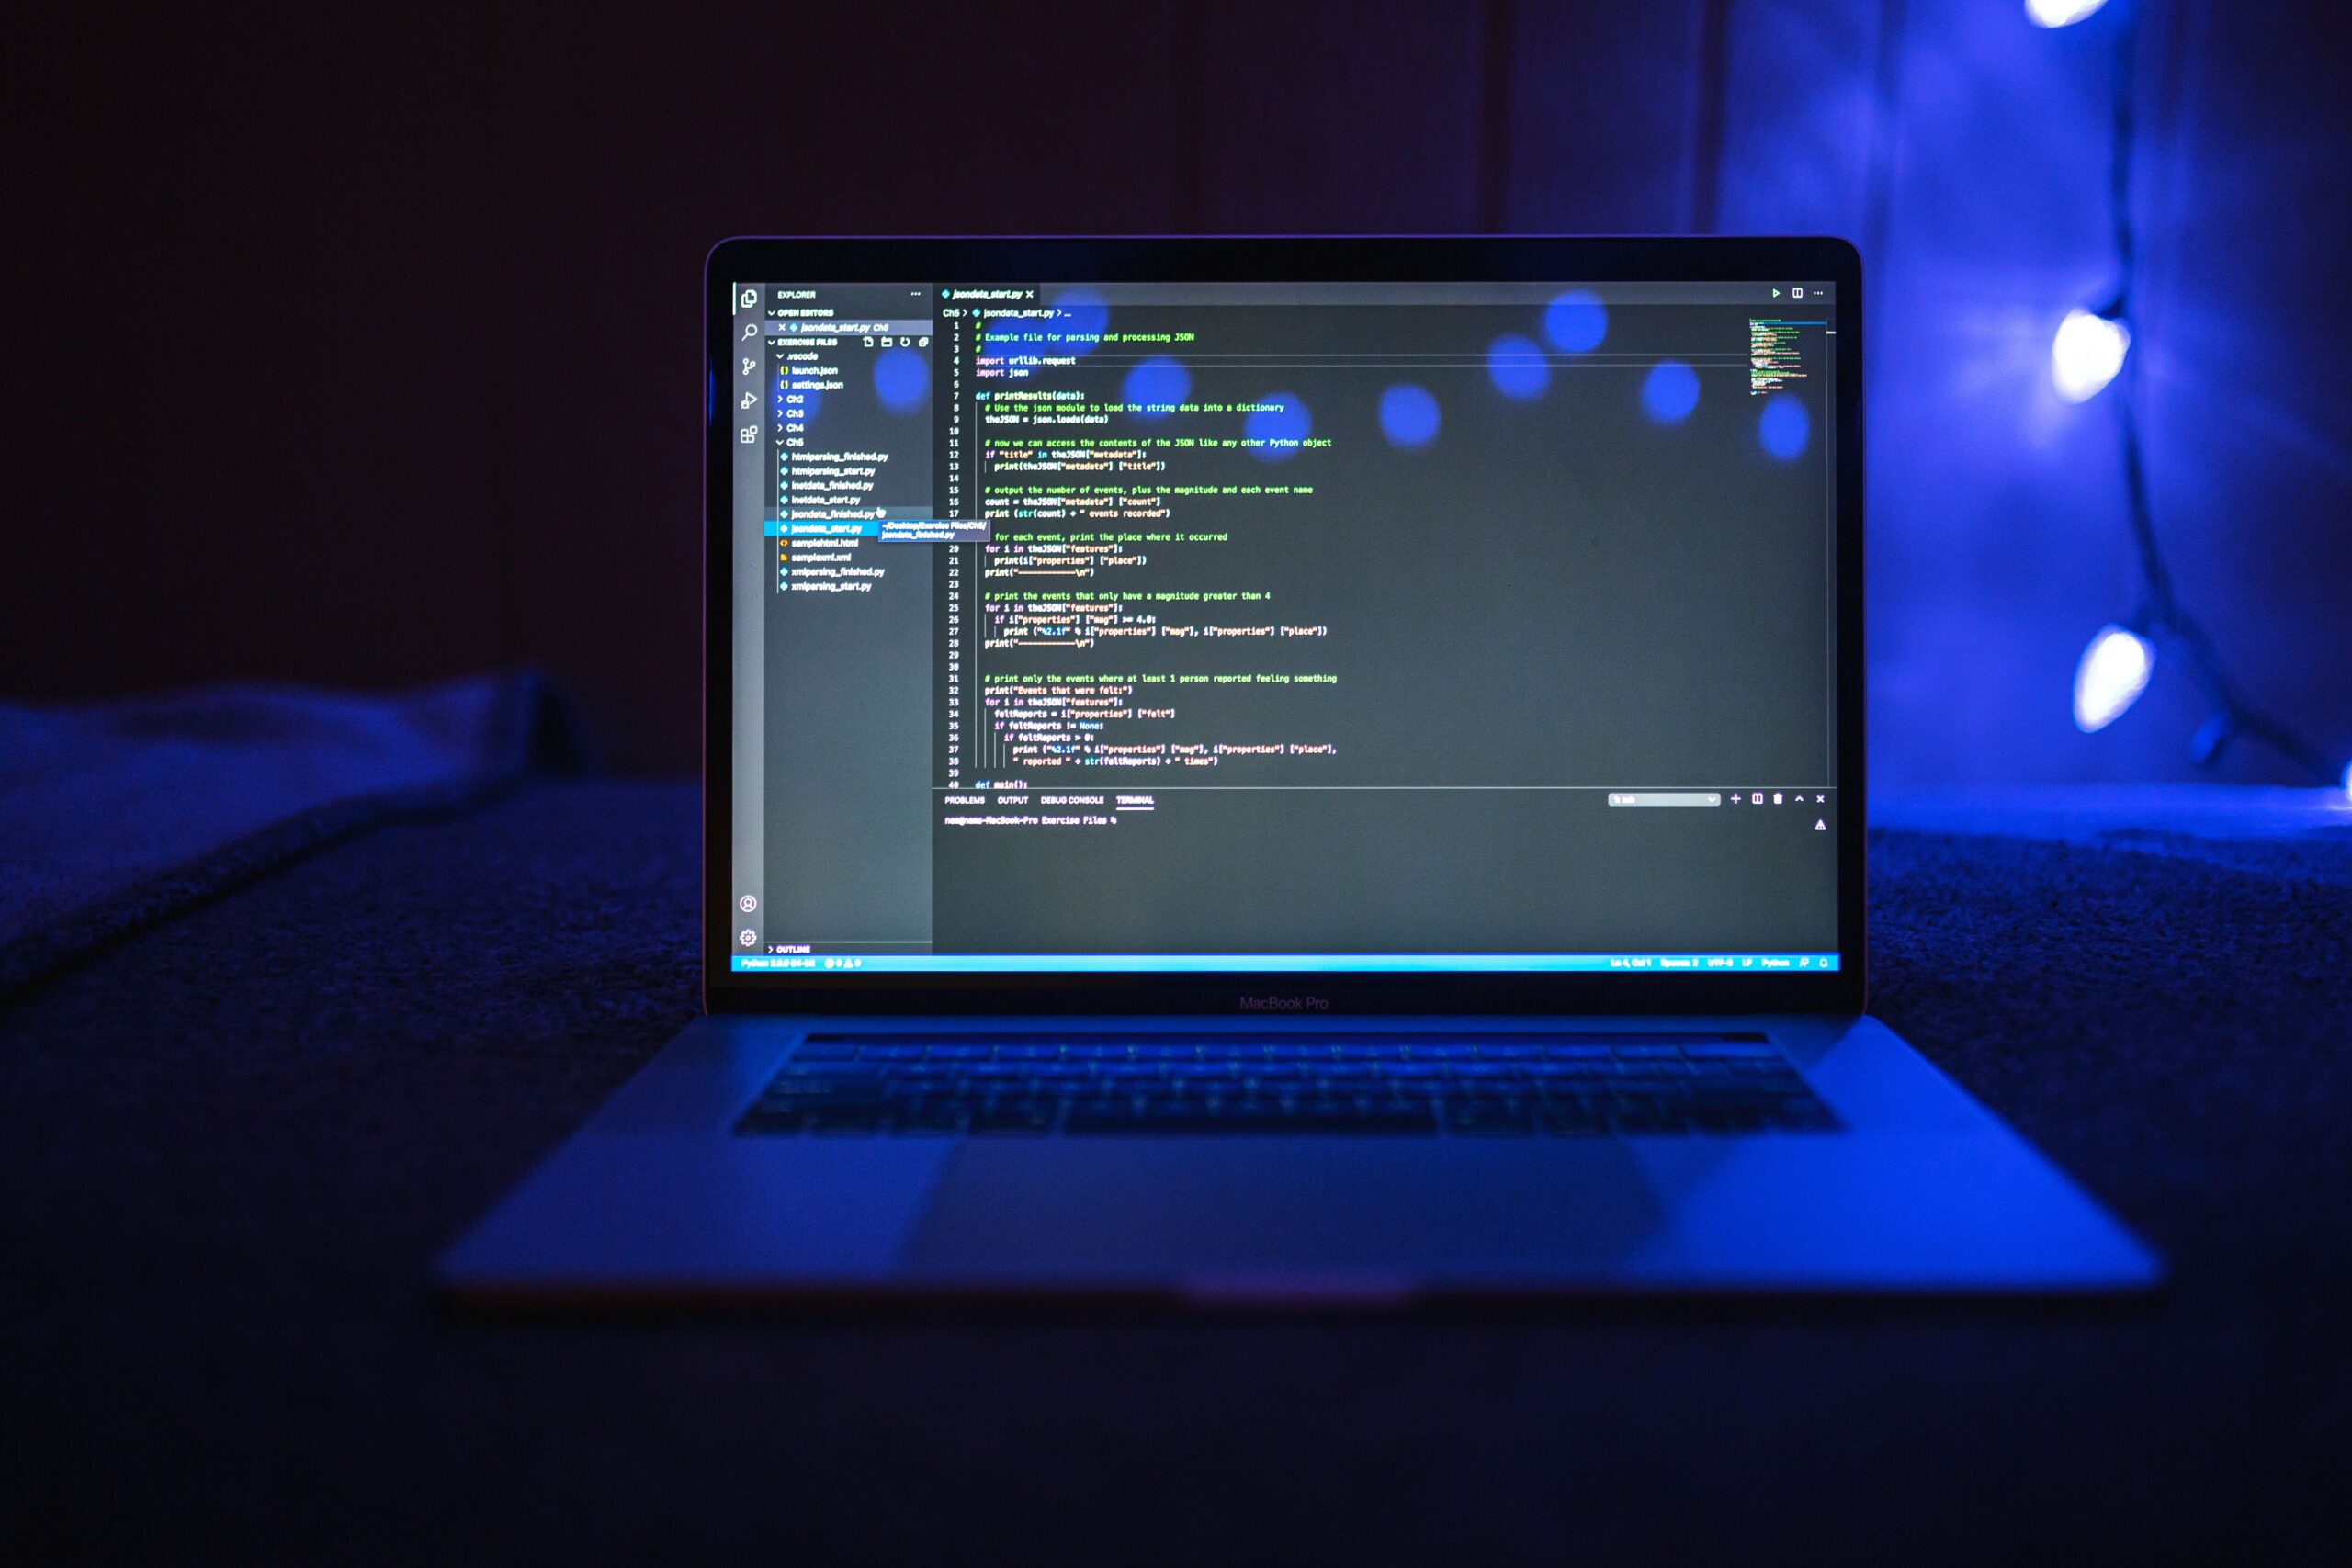
This matters because trading strategies tend to lose their edge once they become widely known — a pattern that works well when only a handful of traders exploit it often weakens once everyone is watching for the same thing. Custom-built indicators, developed and refined privately, let professionals maintain an edge that generic, publicly available tools simply cannot offer. It also allows for continuous iteration: as market conditions shift, the underlying logic can be adjusted and retested rather than abandoned altogether.
A Tool, Not a Substitute for Judgment
None of this eliminates risk, and no analytical system can predict markets with certainty. Prices move on unexpected news, shifting policy, and crowd psychology that no dataset fully captures in advance. The traders who get the most value from these tools tend to treat them the same way a pilot treats an instrument panel: a source of continuously updated information that informs a decision, rather than a system that is trusted blindly.
What has changed is the baseline. Chart analysis that once took hours can now take minutes. Cross-referencing a setup against years of historical precedent, once impractical for an individual trader, is now routine. And building a genuinely personalized indicator no longer requires a background in software engineering. The traders adapting fastest to this shift are not necessarily the ones with the most capital, but the ones willing to treat these tools as an extension of their own analysis rather than a replacement for it.
\ Get the latest news /